


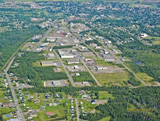


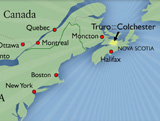


"Let CoRDA connect you. Discover the friendly, convenient, diverse and prosperous communities of Truro:::Colchester. We can help you find what you need to help you grow your business, make a home and build the life of your dreams."
About Us
The Colchester Regional Development Agency's (CoRDA's) mission is to drive sustainable economic growth, creating healthy communities, prosperous business and opportunity for our citizens.
We take our job seriously. But that's not the only reason we're good at what we do. CoRDA was formed in 1992 when a group Colchester citizens recognized the need to work together to promote the region. This grass-roots approach to building a strong community still guides everything we do... Find out more!
Immigration
Recognizing the value that new ideas, experiences and cultures bring to our community, we are committed to welcoming newcomers to Truro:::Colchester.
Through an extensive network of community, provincial and federal partners, CoRDA will work to ensure that you have the information and supports that you need to connect with the opportunities and resources that will enable you to be successful in our region. Find out more!
Business
Savvy business people know that true success requires a perfect combination of very important elements – robust demand, affordable and efficient access to market and a stellar pool of human resources to draw upon.
That's why more and more savvy sports businesses like this one are discovering the benefits of choosing Colchester. And why not? We're not the only ones talking about our advantages. According to KPMG, Colchester is among Canada's very best places in which to build and operate a business... Find out more!